A Global Comparison of Restaurants in OpenStreetMap and Overture Places
Why OpenStreetMap?
OpenStreetMap (OSM) is possibly one of mankind's greatest accomplishments, next to Wikipedia and going to the moon. It's a dataset created entirely by volunteers trying to map the whole world.
It's fair game to map almost anything in OSM, whether it's a hospital or a manhole cover.
The best part is it's licensed for FREE so that anyone can use it, the only requirement is attribution. Without it, Surprise Date Spot could not exist.
What is Overture?
In contrast with OSM, which was created in 2004, Overture is the new kid in school.
First released in April 2023, Overture Maps is a permissively licensed dataset created by a foundation of big tech companies like Amazon, Meta (Facebook), and Microsoft.
This dataset is more top-down. Rather than being created by individual volunteers like OSM, Overture is a combination of proprietary and open datasets organized by major tech companies.
Overture also uses OpenStreetMap within its own dataset, in addition to proprietary ones.
From Overture's FAQ:
What is the relationship between Overture and OpenStreetMap?
Overture is a data-centric map project, not a community of individual map editors. Therefore, Overture is intended to be complementary to OSM. We combine OSM with other sources to produce new open map data sets. Overture data will be available for use by the OpenStreetMap community under compatible open data licenses. Overture members are encouraged to contribute to OSM directly.
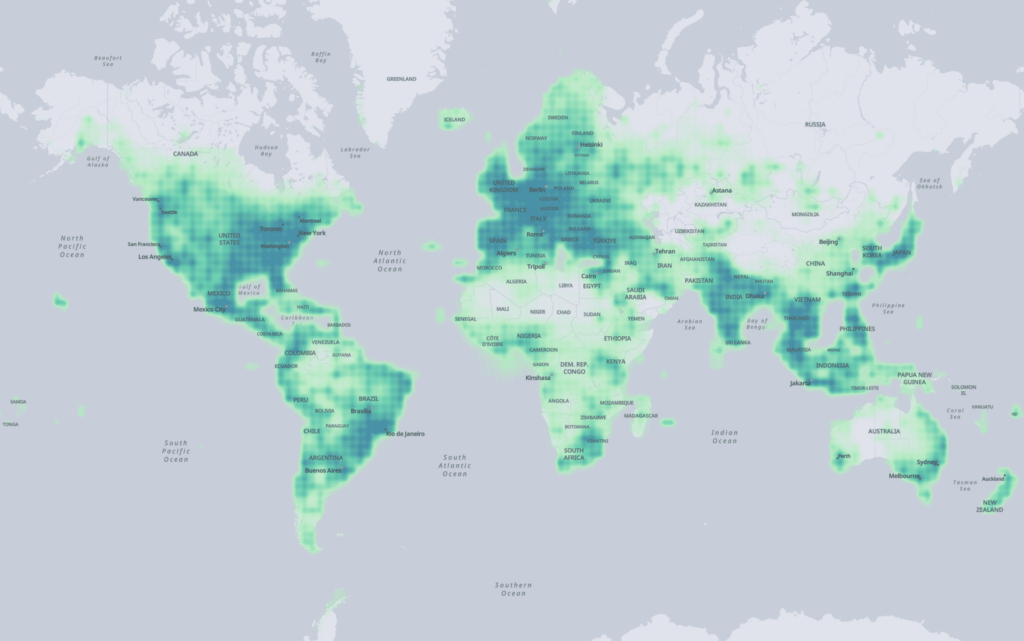
Overture Places
As of 2024, Overture has released the following datasets:
- Addresses
- Buildings
- Administrative Divisions
- Places
- Transportation
However, the most interesting to me is the Places dataset. Places are defined as: "point representations of real-world entities: schools, businesses, hospitals, religious organizations, landmarks, mountain peaks, and much more."
...and most importantly, the dataset contains restaurants!
Meta and Microsoft contributed 53.5 million places into the dataset, Meta contributing 90% of that total.
Overture data can be explored at Overture Maps Explorer
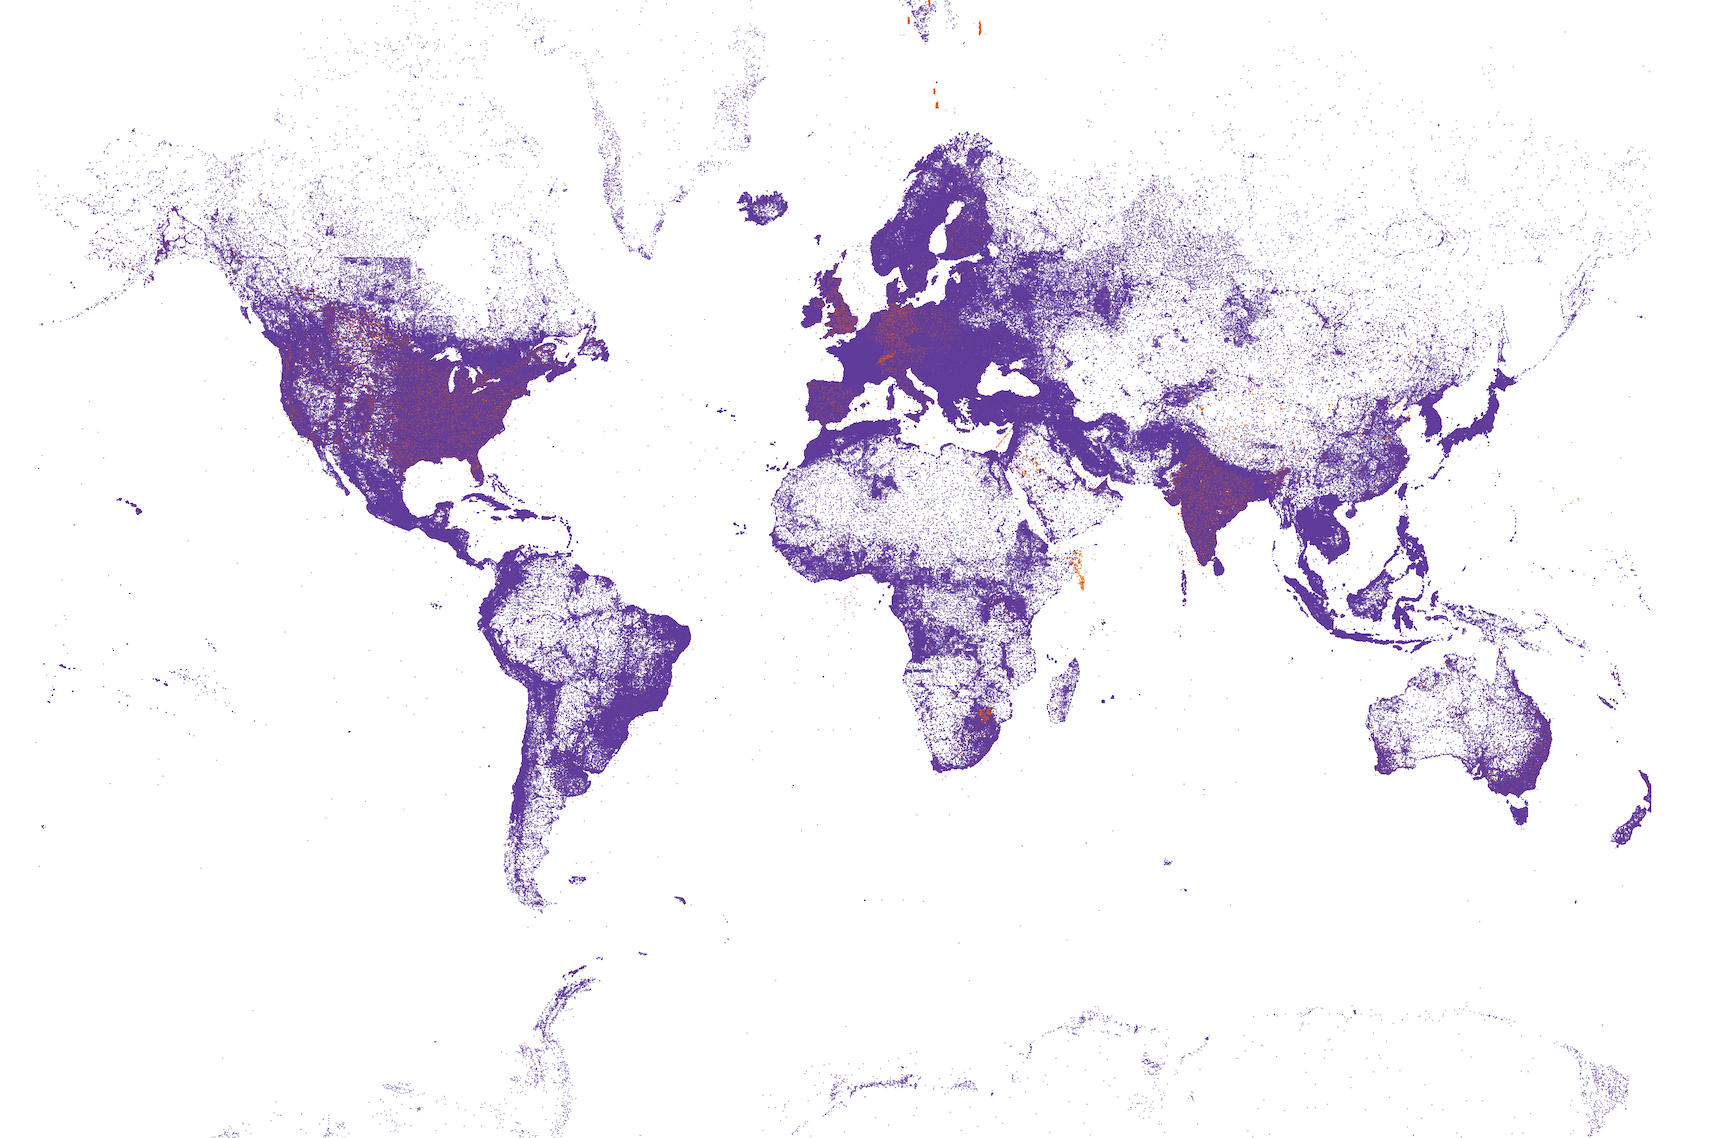
Comparing OSM to Overture Places
Since Overture Places was released, people have been curious about how it compares to OSM.
Generally, Overture relies more on automatic processes than OSM. OSM discourages data that was not human-verified, and so the data is generally higher quality where mappers live, and missing where they don't.
Restaurants in particular are difficult to keep updated, because the industry has high turnover.
Restaurants
By using taginfo and duckDB, I compared the total number of restaurants.
According to taginfo,
there are 1,502,472 amenity=restaurant tags and 581,777 amenity=fast_food tags in OpenStreetMap,
giving a total of 2,084,249 restaurants.
In Overture, the number of restaurants was found with these DuckDB queries:
SELECT COUNT(*)
FROM read_parquet('s3://overturemaps-us-west-2/release/2024-09-18.0/theme=places/*/*')
WHERE categories.primary ILIKE '%restaurant%' AND categories.primary != 'fast_food_restaurant';

3420767
SELECT COUNT(*)
FROM read_parquet('s3://overturemaps-us-west-2/release/2024-09-18.0/theme=places/*/*')
WHERE categories.primary = 'fast_food_restaurant';

158409
What's interesting to me is that Overture has proportionally fewer fast food restaurants than OSM. This might be because Overture has a more nuanced tagging scheme that might prioritize more specific categories over a generic "fast food" label.
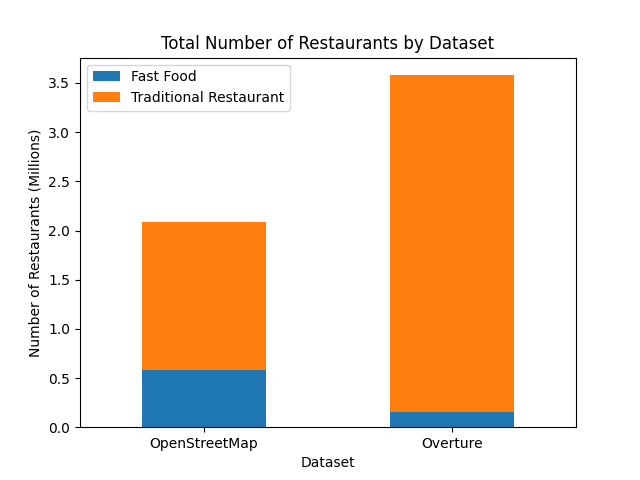
Overall, Overture contains more restaurants than OSM. But, we don't know how accurate the data is. These could be restaurants that have already closed or other bad data.
Quantity is not necessarily better than quality.
So let's try to assess quality.
Comparison Methodology
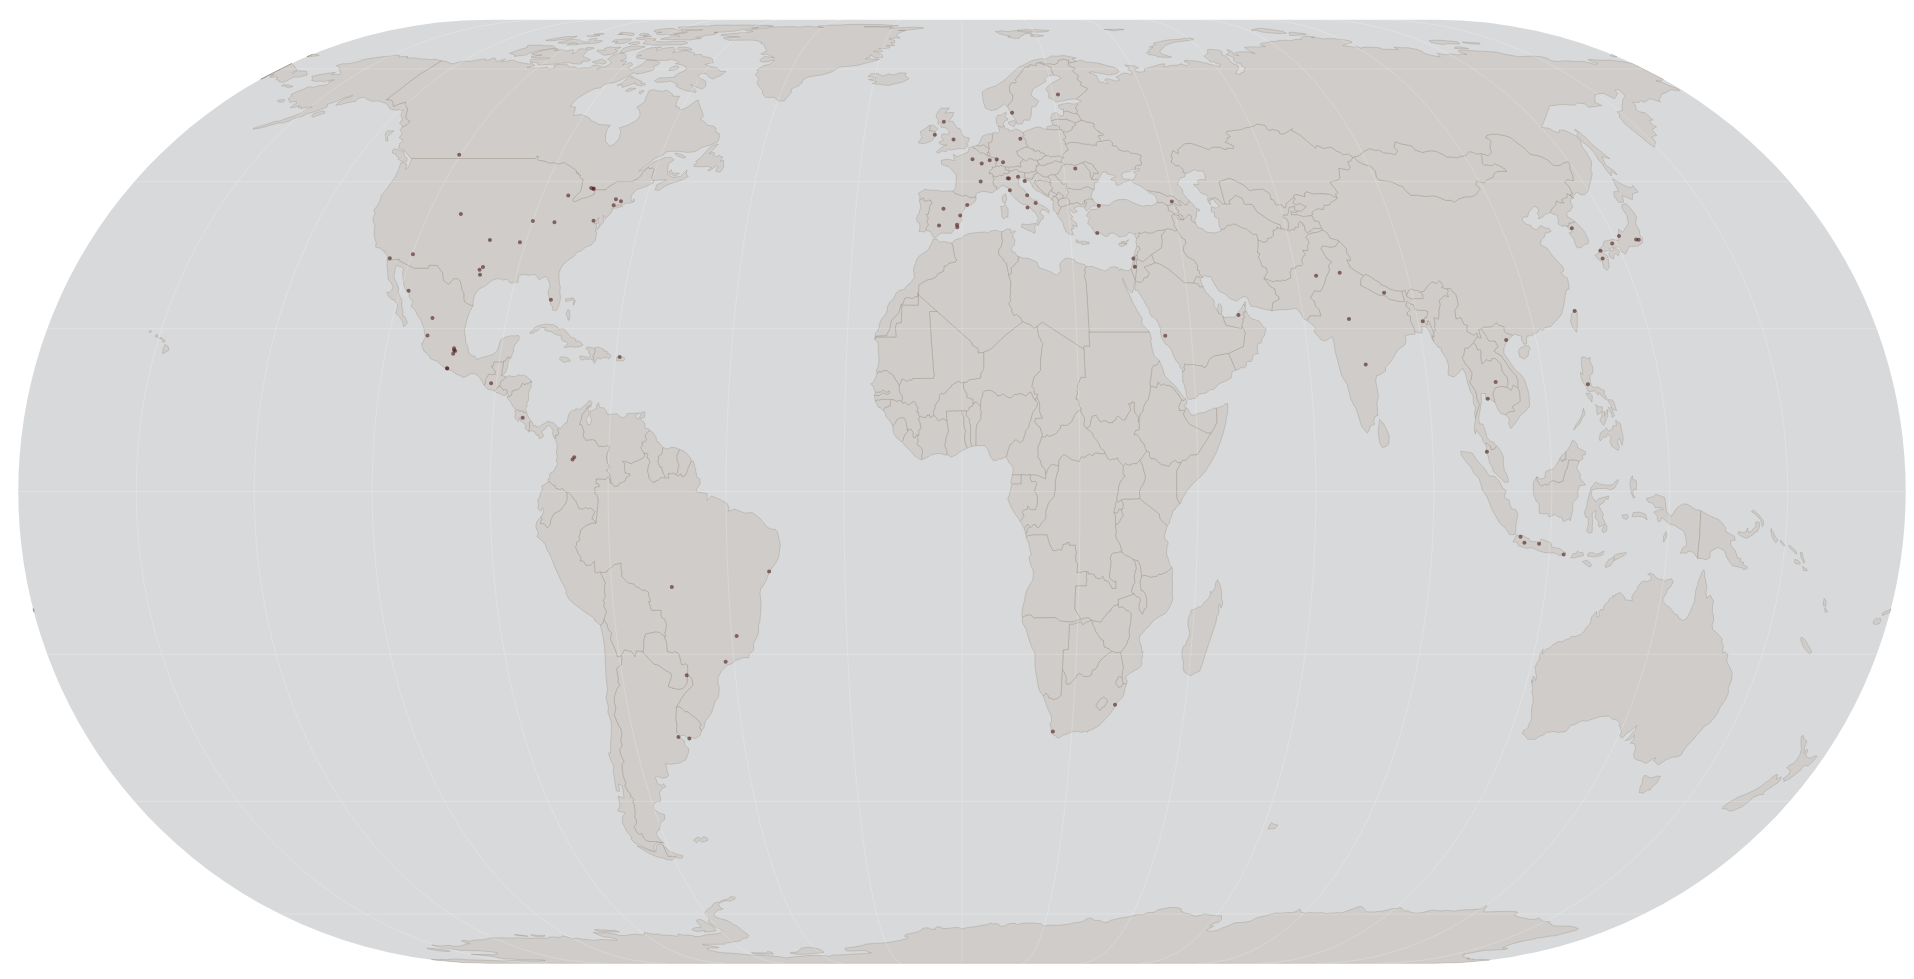
My approach for comparing the two datasets was to pick 100 restaurants from each and see if they exist in the other.
These restaurants were chosen completely at random, anywhere across the globe.
I will also check Google Maps and other sources to see if they corroborate the data.
Location
In order to validate the data in Google Maps, the restaurant had to appear reasonably close (on the same block) to the origin location to be considered "found".
There were a few restaurants that did not meet this criteria in Overture, presumably due to bad geocoding.
Sampling the Data
Fetching the data from OpenStreetMap:
INSTALL spatial;
LOAD spatial;

COPY (SELECT 'https://www.openstreetmap.org/' || kind || '/' || id AS osm_link
      FROM st_readOSM('~/Downloads/osm_data/planet/planet-241017.osm.pbf')
      WHERE tags['amenity'] = ['restaurant'] AND tags['name'] != []
      ORDER BY random()
      LIMIT 100)
TO 'osm_restaurants_sample.csv' (HEADER, DELIMITER ',');
NOTE: the ORDER BY random() is needed to ensure the default ordering is not used, which biases the results towards the beginning of the file, i.e. the oldest data in OSM. The earlier data happens to be in Europe, which generally has a more active mapping community.
Fetching the data from Overture:
COPY (SELECT names.primary AS name, id, confidence,
              'https://explore.overturemaps.org/#15/'
              || ST_Y(geometry)
              || '/' || ST_X(geometry) AS overture_link
          FROM read_parquet('s3://overturemaps-us-west-2/release/2024-09-18.0/theme=places/*/*')
          WHERE categories.primary ilike '%restaurant%' ORDER BY random() LIMIT 100
      ) TO 'overture_restaurants_sample.csv';
I then manually went through all these restaurants and checked if they exist:
- In OpenStreetMap
- In Overture
- In Google Maps
A note on Google Maps
I would expect Google Maps to be the closest dataset to ground truth globally, because it has the most users to suggest edits when restaurants change.
However, even Google Maps has issues, and in some cases it may be less accurate than ground truth. We would need to coordinate a global survey to actually confirm accuracy against ground truth, so Google Maps will only have to serve as a proxy in this case.
I believe Google Maps may be more accurate for the following reasons:
- It has over a billion users, whereas OSM has optimistically around 10 million
- Businesses and SEO organizations know to update listings on Google Maps, but OSM is less well-known
As much as I love OSM and open data, it simply doesn't have the mindshare or userbase that Google Maps does.
Sample Coverage
OpenStreetMap
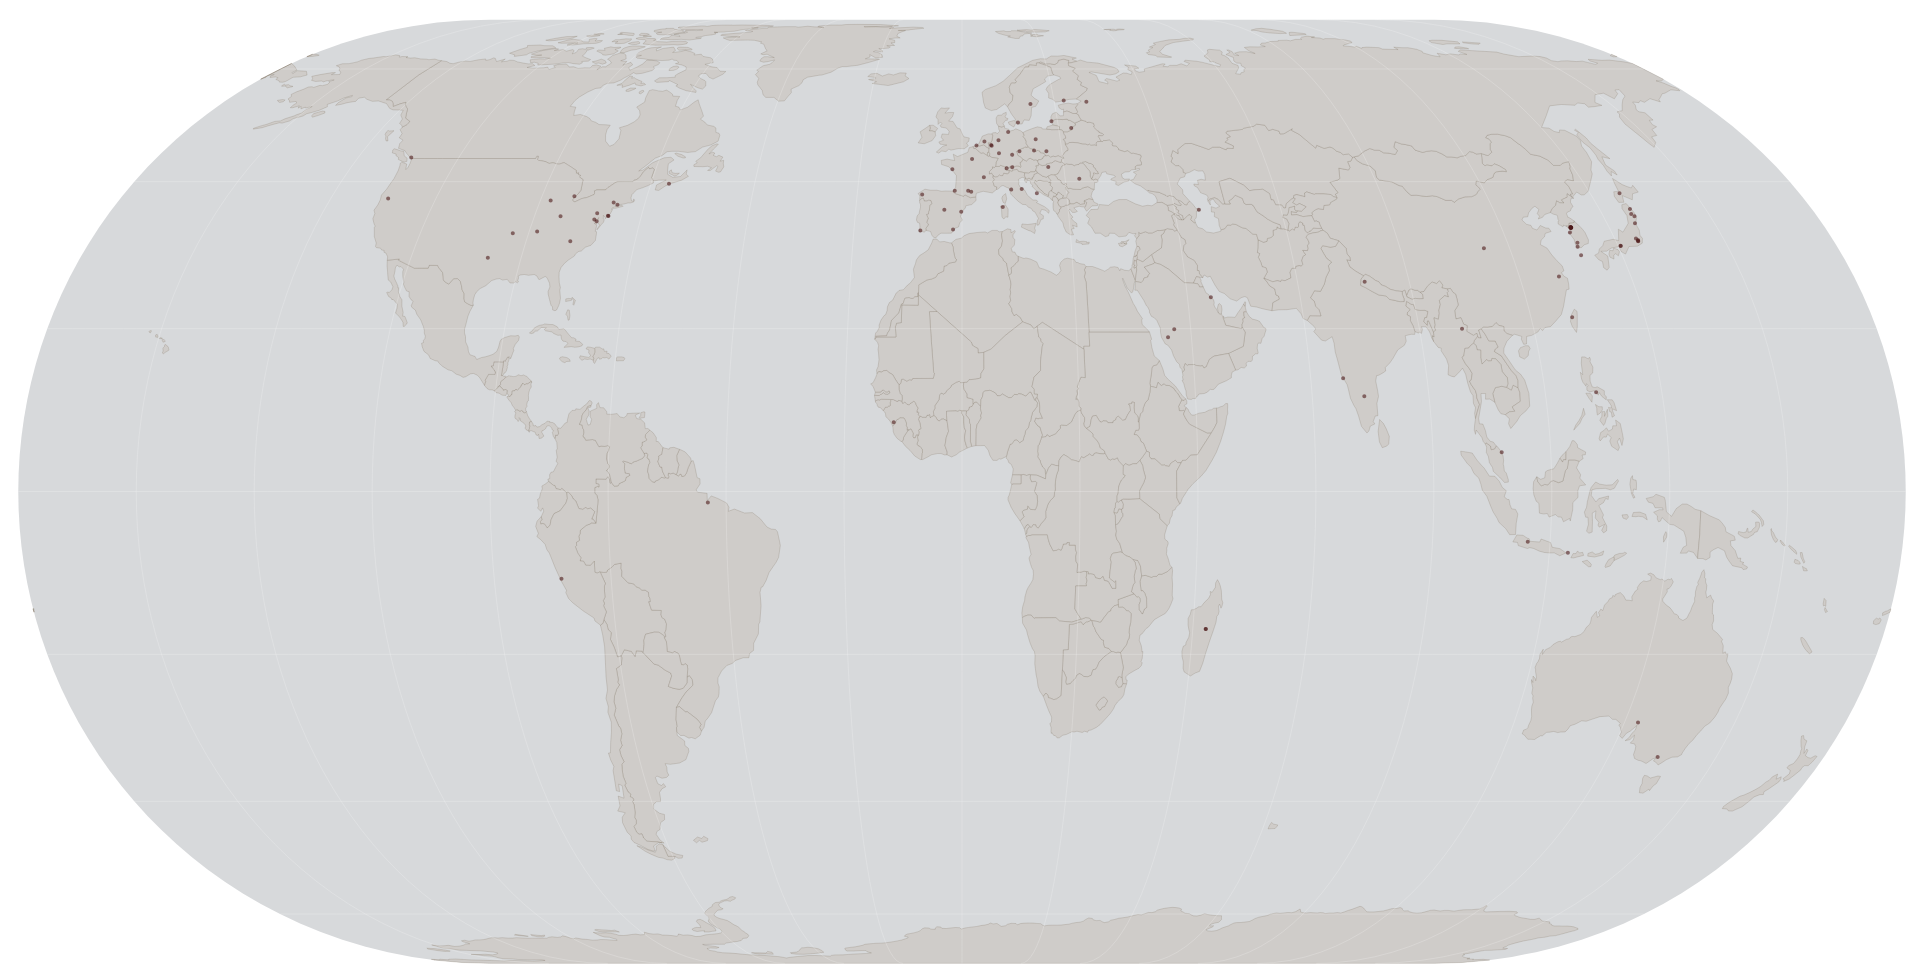
Overture
Confidence Metrics
I've also chosen two metrics for "confidence" in the data. Overture has a built-in confidence metric. For OpenStreetMap, the data is assumed to be fairly accurate when it is first created, but it may get stale over time, so I've chosen "months since last edit" as a proxy for confidence.
I also collected two quality metrics for this data. For OSM, I used age of last edit as a quality metric. For Overture, they have an internal "confidence" score ranging from 0-100%.
Distribution
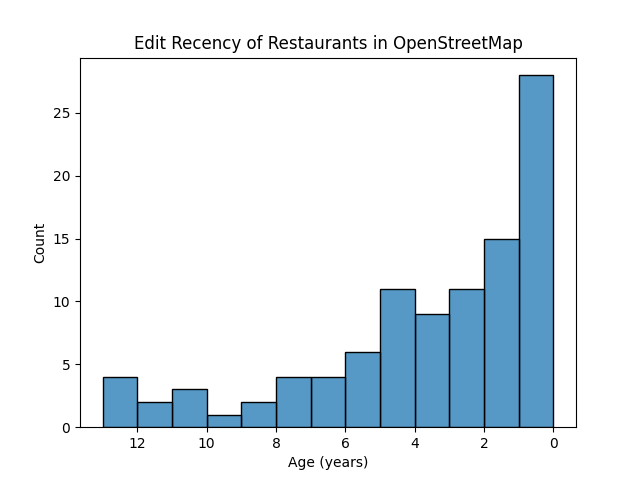
We can see that the majority of restaurants sampled have been edited within the last 3 years. The standard deviation for the data was 3.56 years.
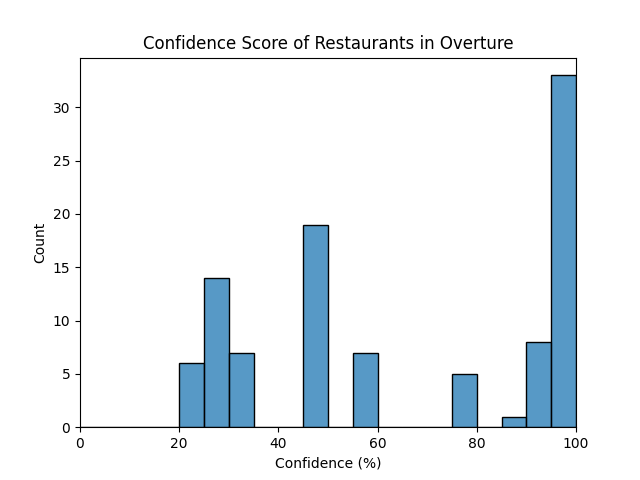
Over 40% of the sampled restaurants have more than 90% confidence, but there is not much pattern beyond that. The standard deviation was 29.1%
I was a bit surprised to see some stratifications in the values, e.g. there are no restaurants in the sample between 60-75% confidence, or between 0-20% confidence. This is probably an artifact of Overture's confidence scoring metric.
Comparing the Data
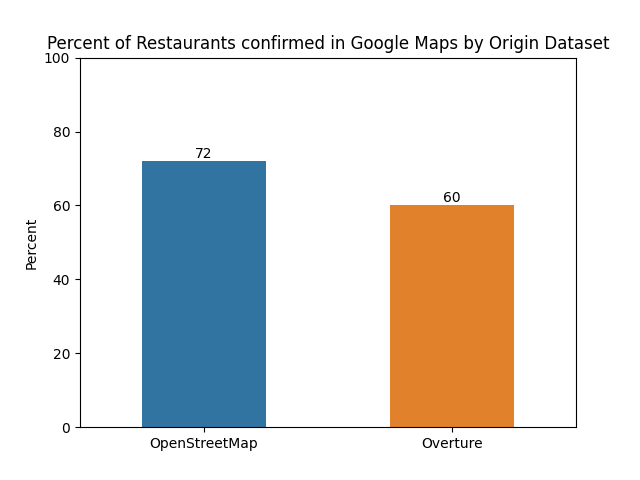
Out of the 100 restaurants that were checked in both OSM and Overture, 72 of the OSM restaurants were found in Google Maps, while only 60 of the Overture restaurants were found.
This doesn't surprise me, because Overture is a more automated process, and contains data that is considered low-confidence by their own metrics.
OpenStreetMap Restaurants vs. Google Maps
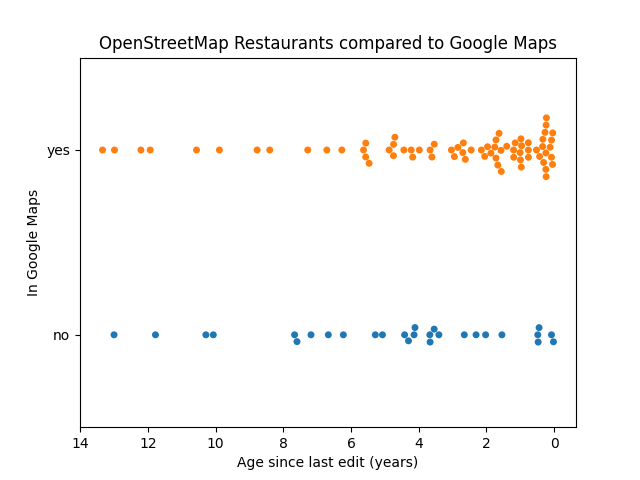
Assuming Google Maps is mostly accurate, this graph shows that editing recency is a positive indicator of data quality in OpenStreetMap. OSM restaurants that have recently been edited are more likely to be confirmed by Google Maps.
Overture Restaurants vs. Google Maps
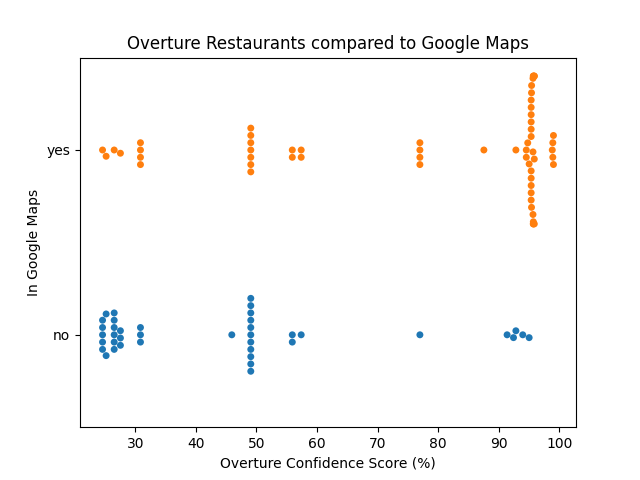
By the same logic, this graph shows that Overture's own quality metric is a strong indicator of accuracy compared to Google Maps.
OpenStreetMap Restaurants vs. Overture
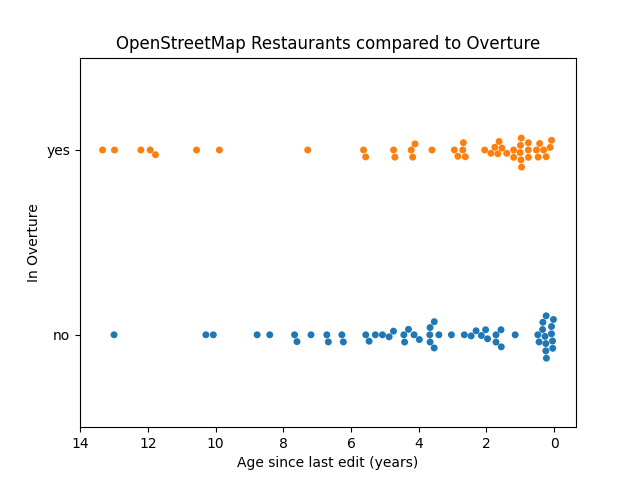
It doesn't seem like Overture uses age as a quality indicator for importing OSM data.
Overture Restaurants vs. OpenStreetMap
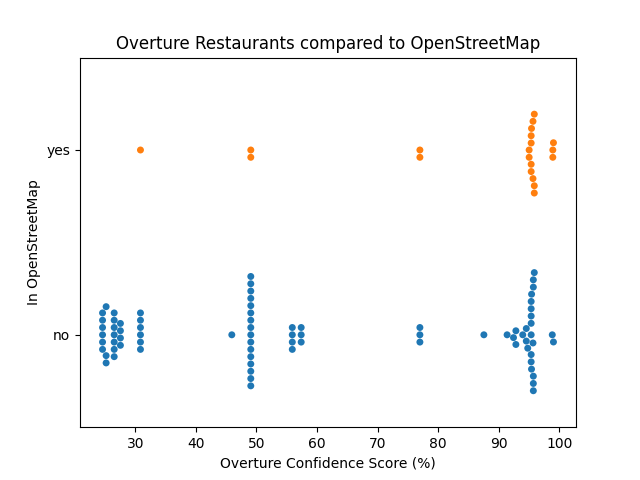
Based on this graph, it seems like a restaurant being high confidence also means it's more likely to be in OSM.
Examining the best data
Since we have a decent quality metric for both datasets, what happens if we look at only the best from each?
I filtered the data to the top 1 standard deviation of both quality metrics used.
So looking at OSM data edited within the last 3.48 years and Overture data with confidence > 71%.
Here are the results:
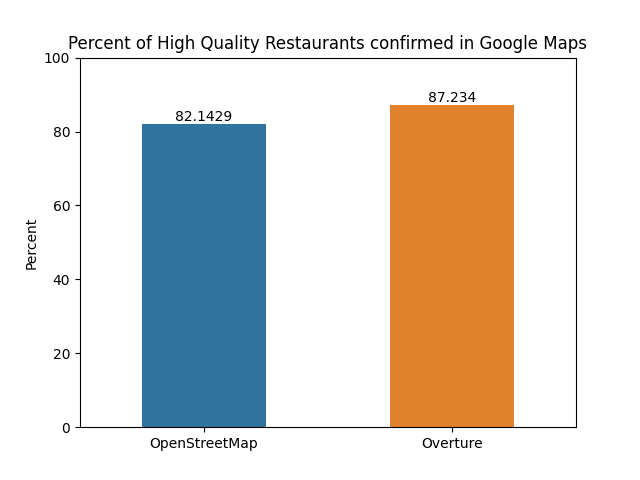
Interestingly, when only considering high-quality data from both sources, Overture seems to do better than OSM.
Next Steps
I would like to see a more thorough exploration comparing the data. I limited this exploration to 100 samples from each dataset, but ideally orders of magnitude more samples could be checked to ensure better coverage in each country.
I suspect the comparative data quality varies a lot by country for both datasets, depending on several factors:
- Facebook adoption rates
- OSM mapping communities
- Open address coverage
So it would be interesting to see this compared for each country.
