What’s in a Name? Discovering Trends in U.S. Restaurant Branding with OpenStreetMap
Background
As I've worked on SurpriseDateSpot.com, I've read a lot of restaurant names, probably thousands. Some of them follow a pattern and some of them try to stand out. I thought it would be interesting to see how different trends appear in naming restaurants.
Fetching the data
I used OpenStreetMap (OSM) to fetch 335,000 restaurant names from restaurants in the United States.
I first downloaded an extract of OSM for the United States from GeoFabrik. Then, using DuckDB, I exported the name of every U.S. restaurant to a CSV file. This export also included the ID, brand identifier, and cuisine for each restaurant.
COPY (
    SELECT tags['name'][1] as name,
    tags['brand:wikidata'][1] as brand_wikidata,
    tags['cuisine'] as cuisine,
    id
    FROM st_readOSM('~/Downloads/us-latest.osm.pbf')
    WHERE (tags['amenity']=['restaurant'] OR tags['amenity'] = ['fast_food'])
    AND tags['name'] != []
) TO 'osm_us_restaurants.csv';
Then in Python, I imported the data to a Pandas dataframe.
with open("osm_us_restaurants.csv") as f:
    df = pd.read_csv(f)

print(df)
                              name brand_wikidata                                 cuisine        id
0       Southern Sun Pub & Brewery            NaN                                      []  25782064
1               Front Street Diner            NaN              [burger;sandwich;american]  26319966
2                         Boulders            NaN                                      []  29352403
3                       Joe's Deli            NaN                                      []  29352406
4                           Subway        Q244457                              [sandwich]  30455276
...                            ...            ...                                     ...       ...
334807                       Sonic       Q7561808                                [burger]  17960452
334808                 The Fox Den            NaN  [american;burger;coffee_shop;regional]  18004076
334809           Easton Pub & Grub            NaN                                      []  18134451
334810                      Chevys       Q5094466                               [mexican]  18182543
334811      China Chef's Carry Out            NaN                               [chinese]  18194763
I also made a version of this data that excludes chain restaurants.
restaurants_without_chains = df[df["brand_wikidata"].isnull()]
Most of this analysis ignores chain restaurants, which are less interesting in showing naming trends, due to the bias of restaurant popularity. I'm more interested in why dozens of Chinese restaurants independently have "88" in their name than why "Five" is in so many restaurants (Five Guys has 1,700 locations).
City names
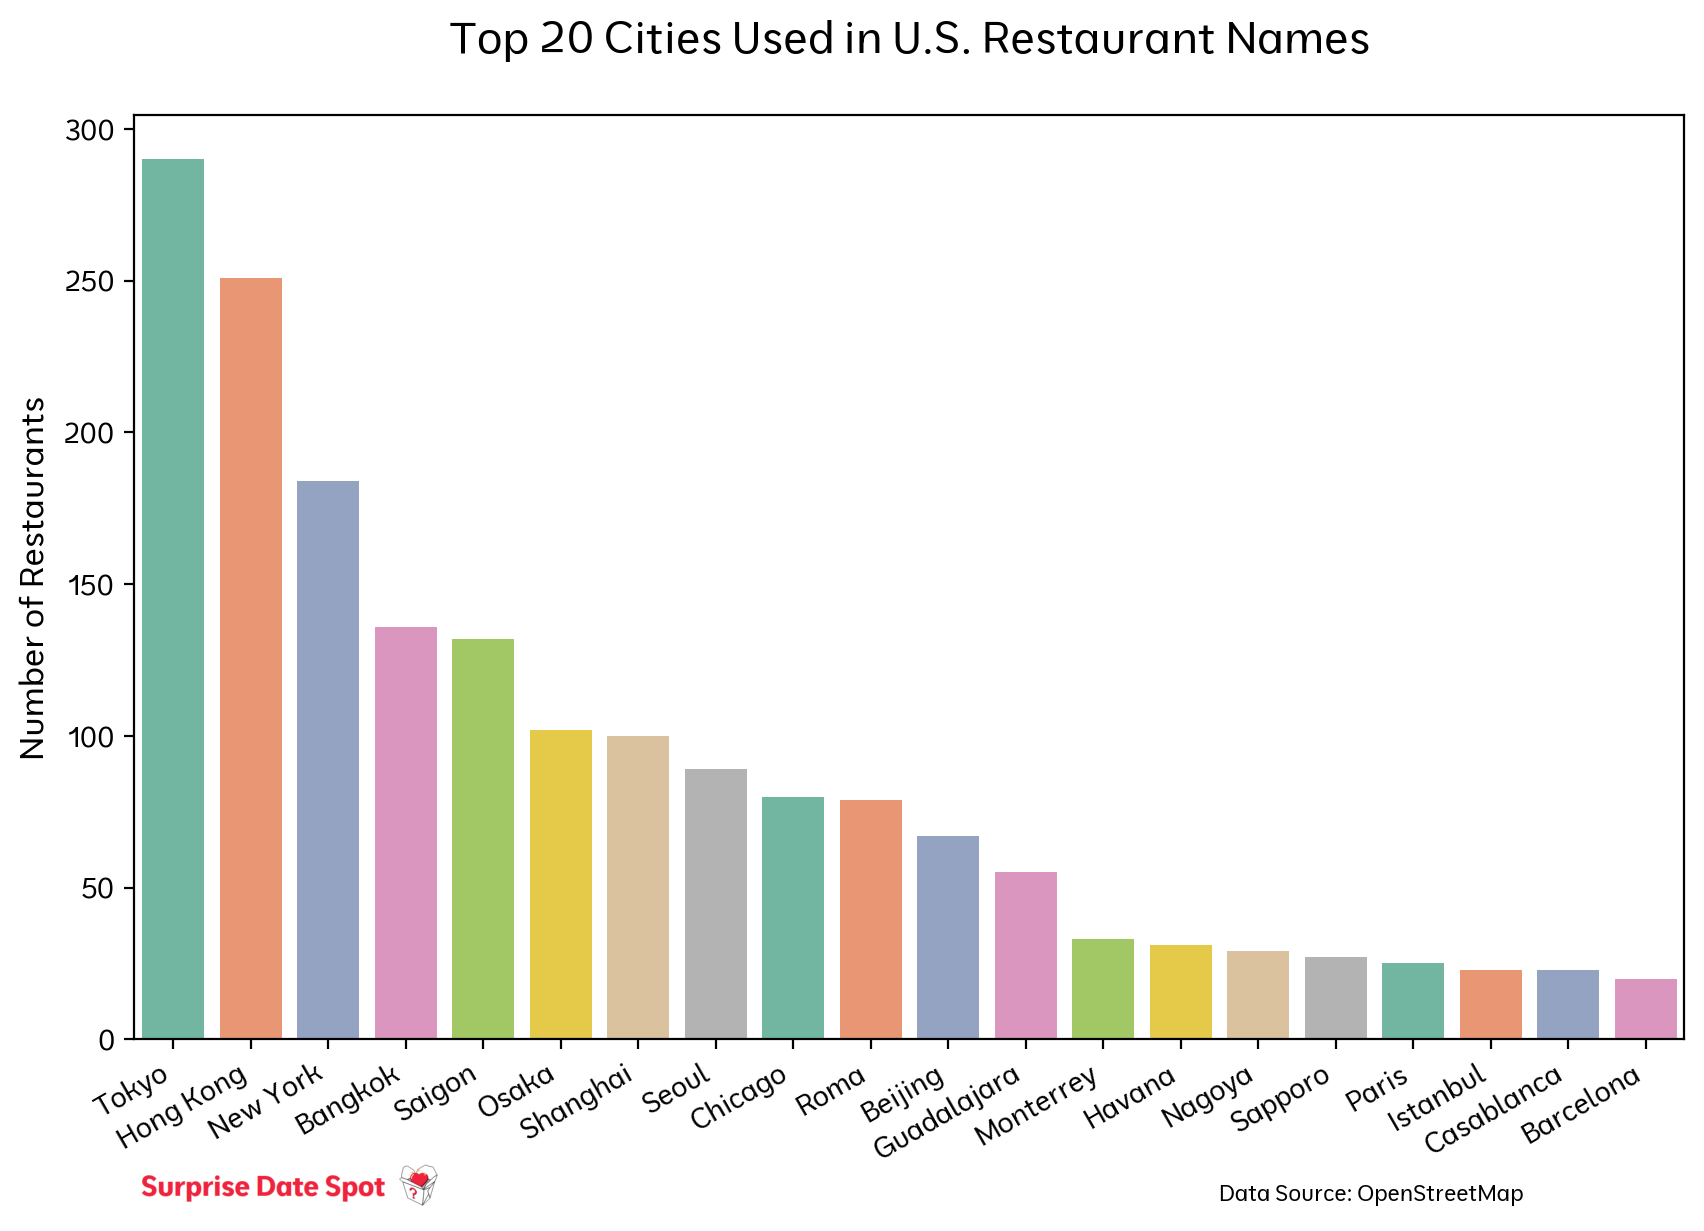
A lot of restaurants have city names in them, usually to signal what kind of cuisine the restaurant serves. E.g. a Japanese restaurant named Tokyo Express, or an Italian restaurant called Roma Pizzeria.
But what city names are most commonly used? I downloaded a list of cities with over 1 million people from Wikipedia, and then used this code to calculate the number of restaurants referencing each city name.
For downloading the data from wikipedia, I found the wikitable2csv tool was incredibly helpful. I just needed to copy the URL and the CSS Selector of the table, and then I could download the data as a CSV.
with open("List_of_cities_with_over_one_million_inhabitants_1.csv") as f:
    all_cities = pd.read_csv(f)

all_cities = all_cities[1:500]

all_cities["us_restaurant_count"] = all_cities.apply(lambda x: len(df[df.name.str.match(r"(^|\s)" + x["City"] + r"($|\s)", case=False)]), axis=1)

top_city_counts = all_cities.nlargest(20, 'us_restaurant_count')
Plotting this data, we get:
Numbers
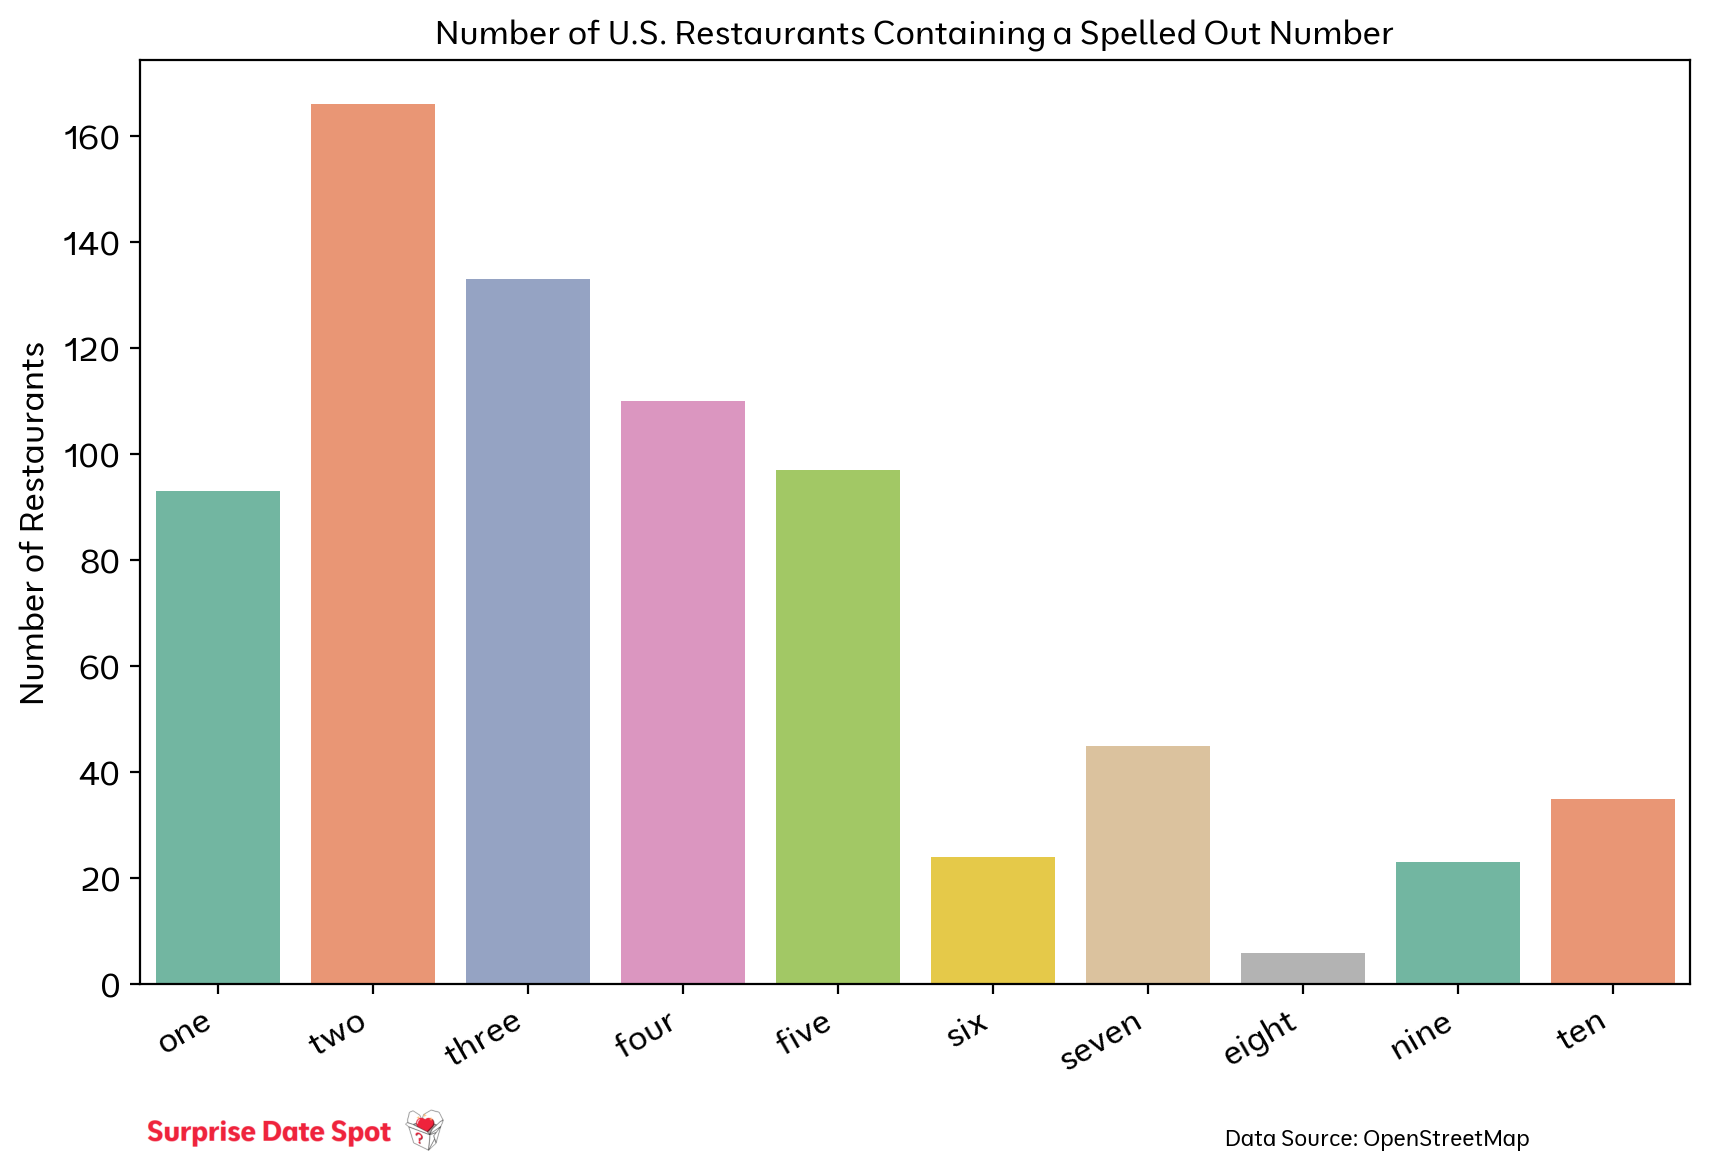
Restaurants often have numbers in them, like "Los 3 Amigos" or "Thai 2 Go". I was curious what the most common numbers are.
First I took a look at the spelled out numbers:
numbers_written = pd.DataFrame({"number": ["one", "two", "three", "four", "five", "six", "seven", "eight", "nine", "ten"]})

numbers_written["us_restaurant_count"] = numbers_written.apply(
    lambda x: len(restaurants_without_chains[
        restaurants_without_chains.name.str.match(r"(^|\s)" + x["number"] + r"($|\s)", case=False)
    ]
), axis=1)
Similarly, I looked at numbers only containing numeric digits, rather than being spelled out.
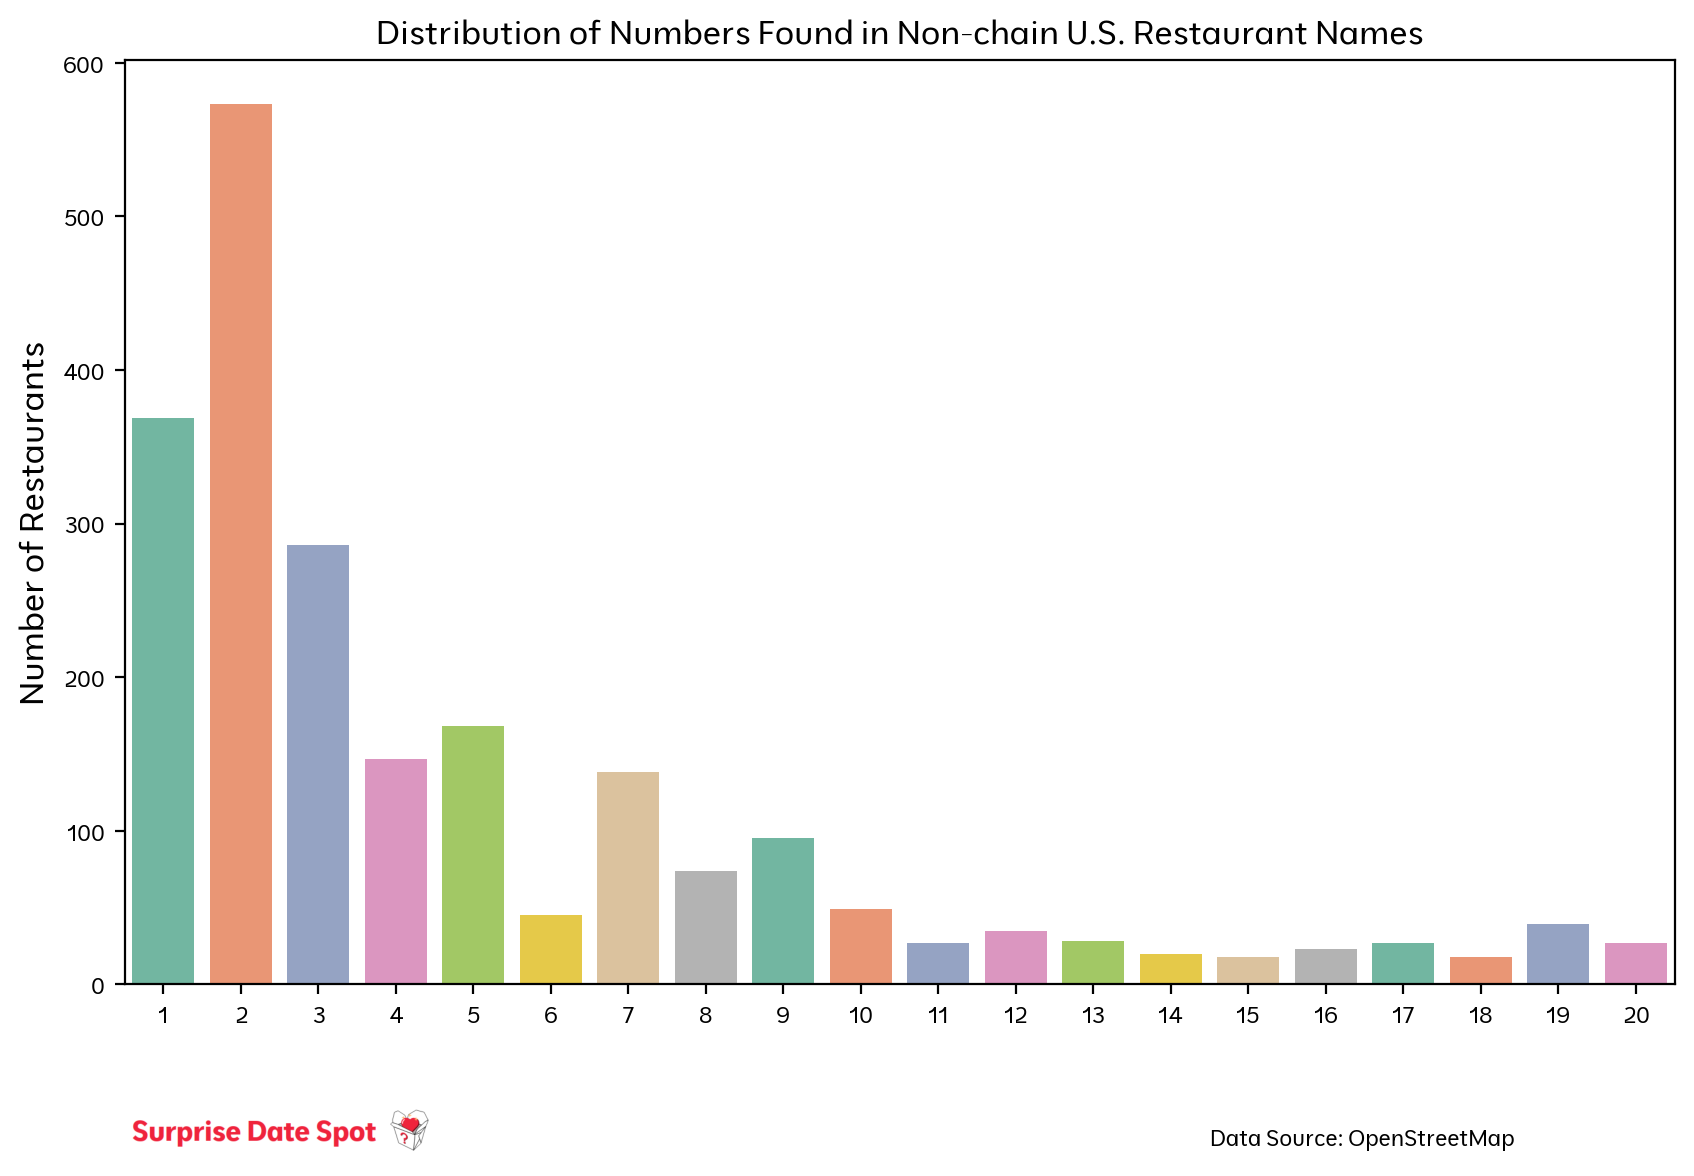
In both cases, 6 seems to be very underrepresented compared to the usage of 5 and 7, which is a bit surprising to me.
I also expanded this up to 100, which was far too wide for a bar chart. This is a heatmap, where color represents the number of restaurants for each number.
Because the results are so skewed towards numbers < 10, I scaled the data on a logarithmic scale, in order to see trends better.
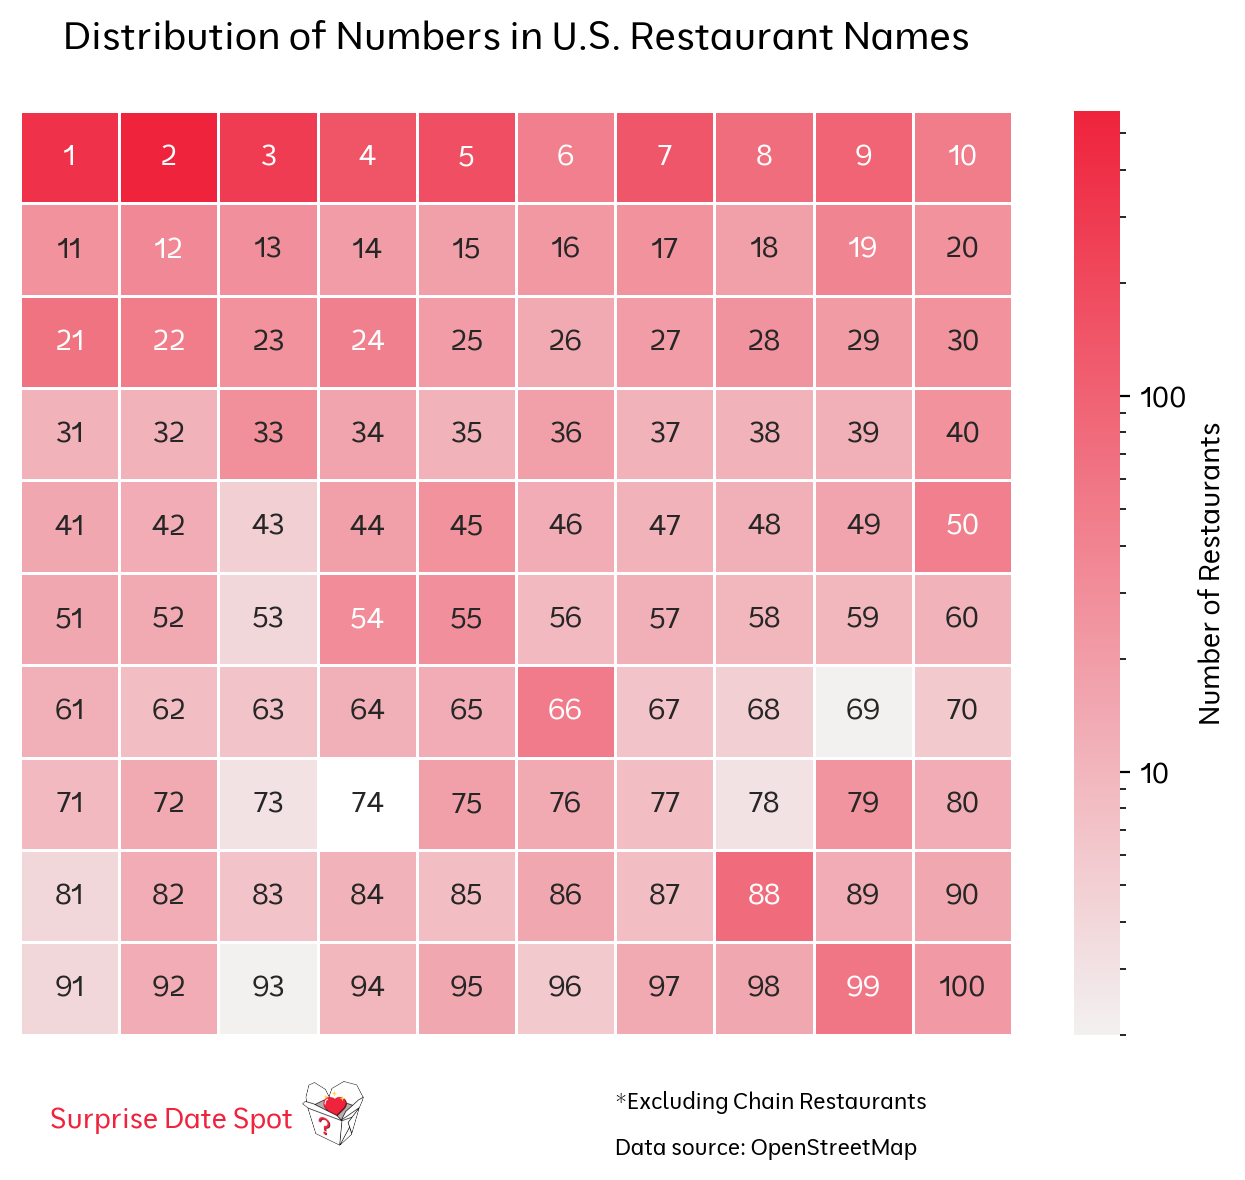
Most numbers in restaurants stay below 10, but there is a spike at 88, which is considered a lucky number in Chinese culture. There is also a spike at 54 and 99, but I'm not sure why.
Possessives
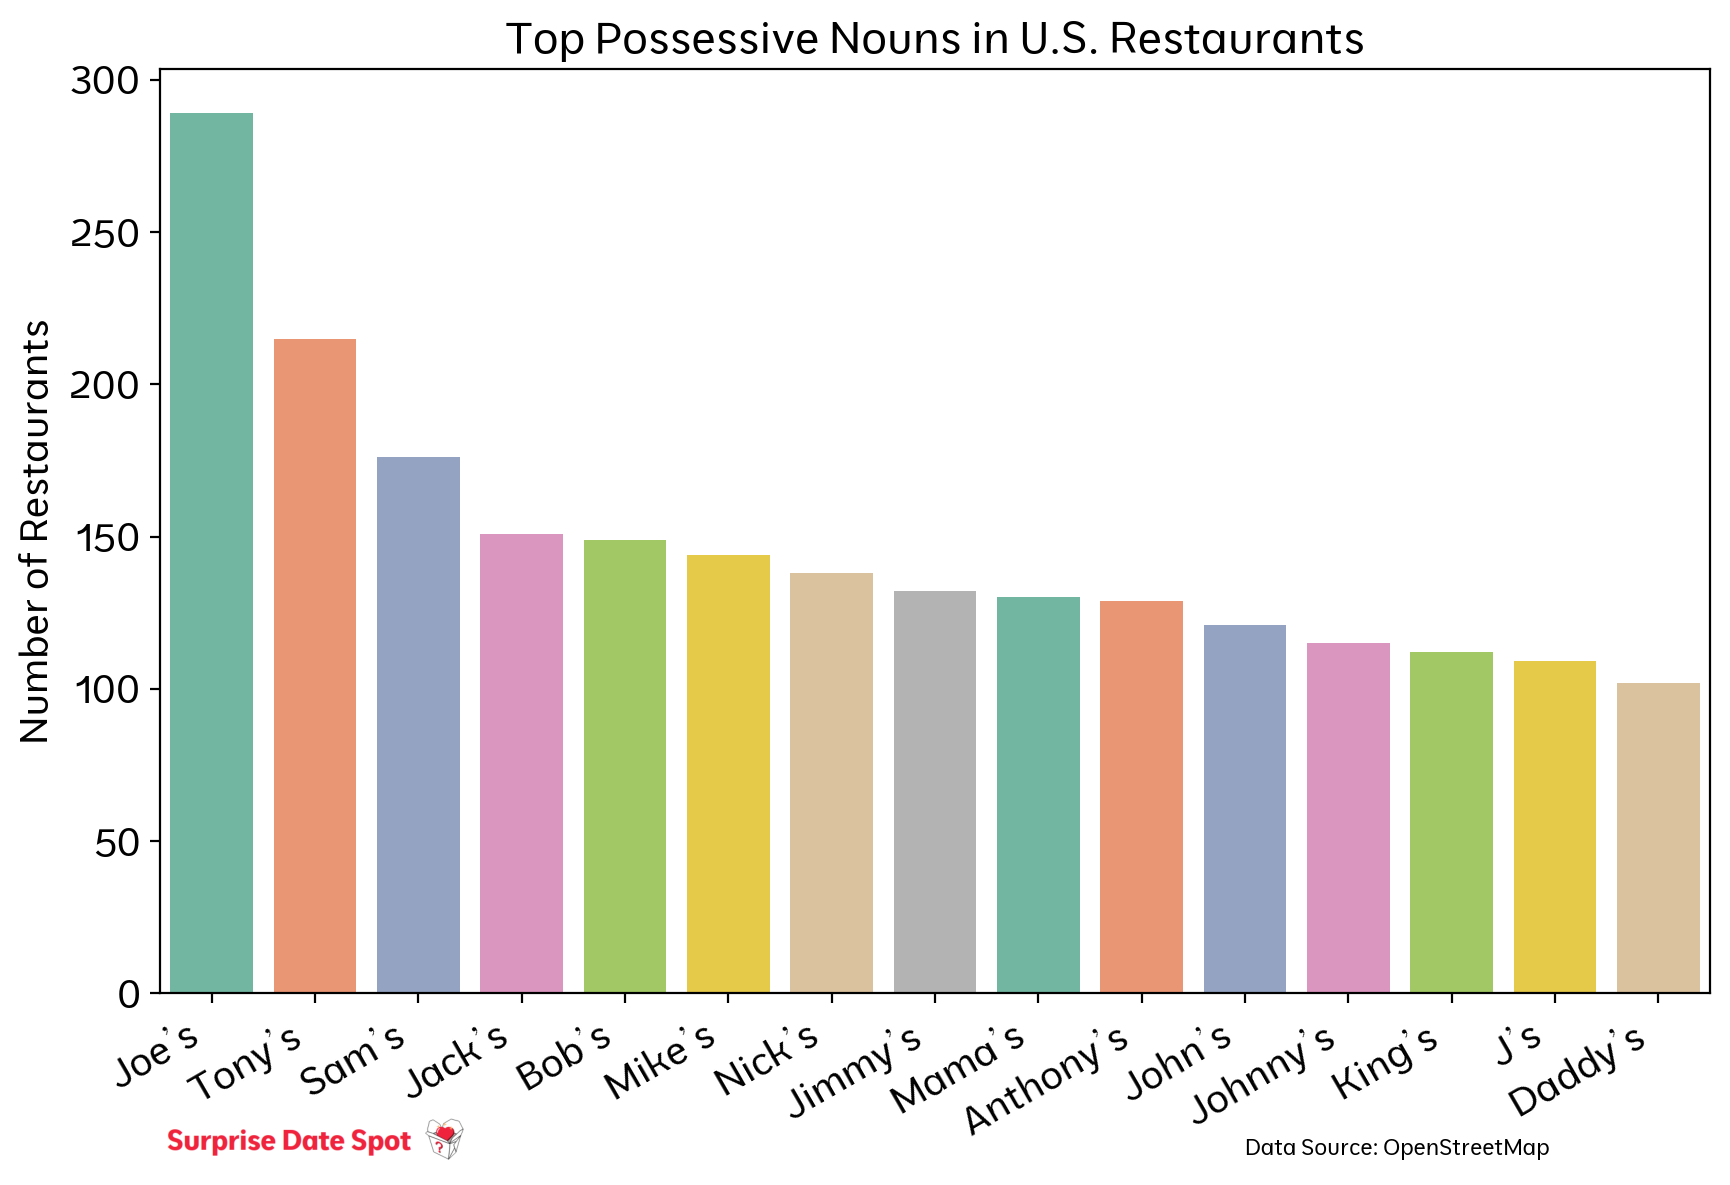
A lot of places are named after the owner. But what names are most likely to be possessing these restaurants?
Animal Names
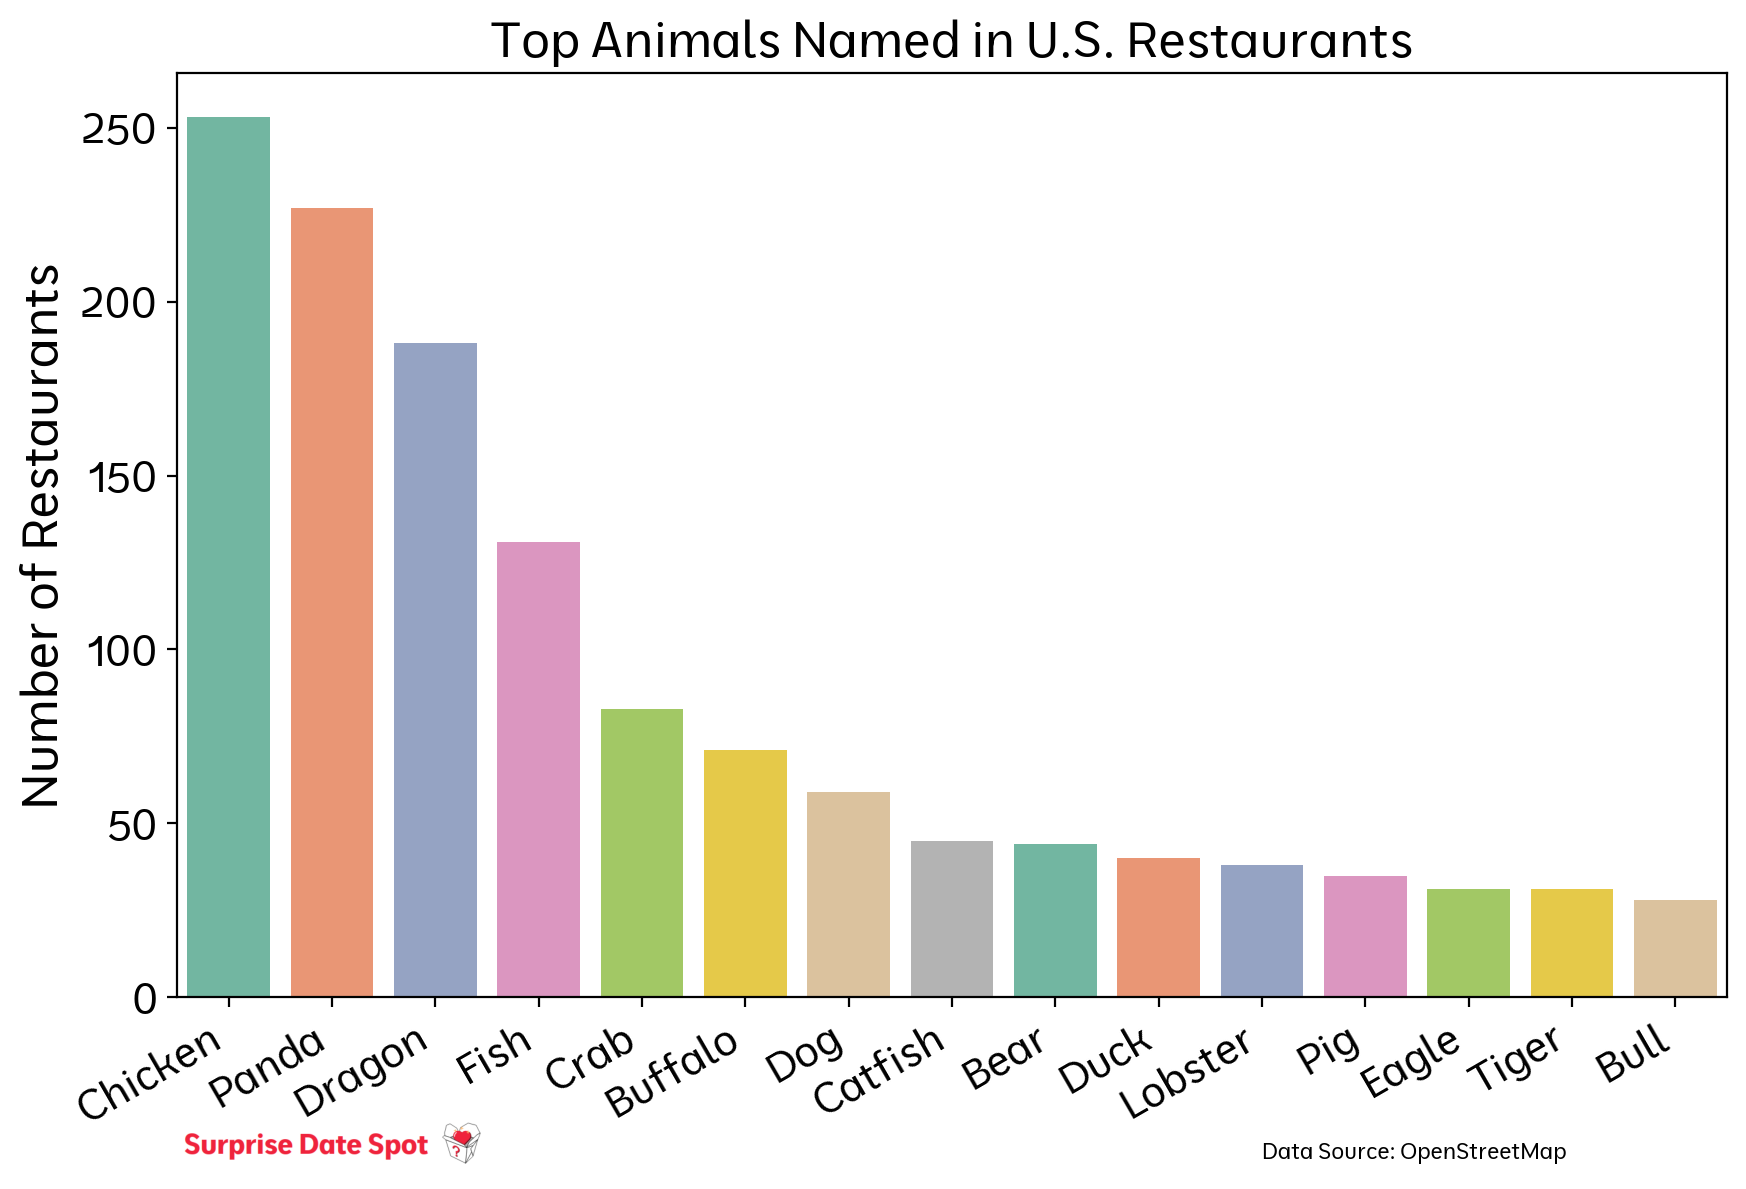
To create this chart, I downloaded a list of animal names from Wikipedia, and tweaked it a little bit to add other animal names (e.g. Dragon).
Crustaceans
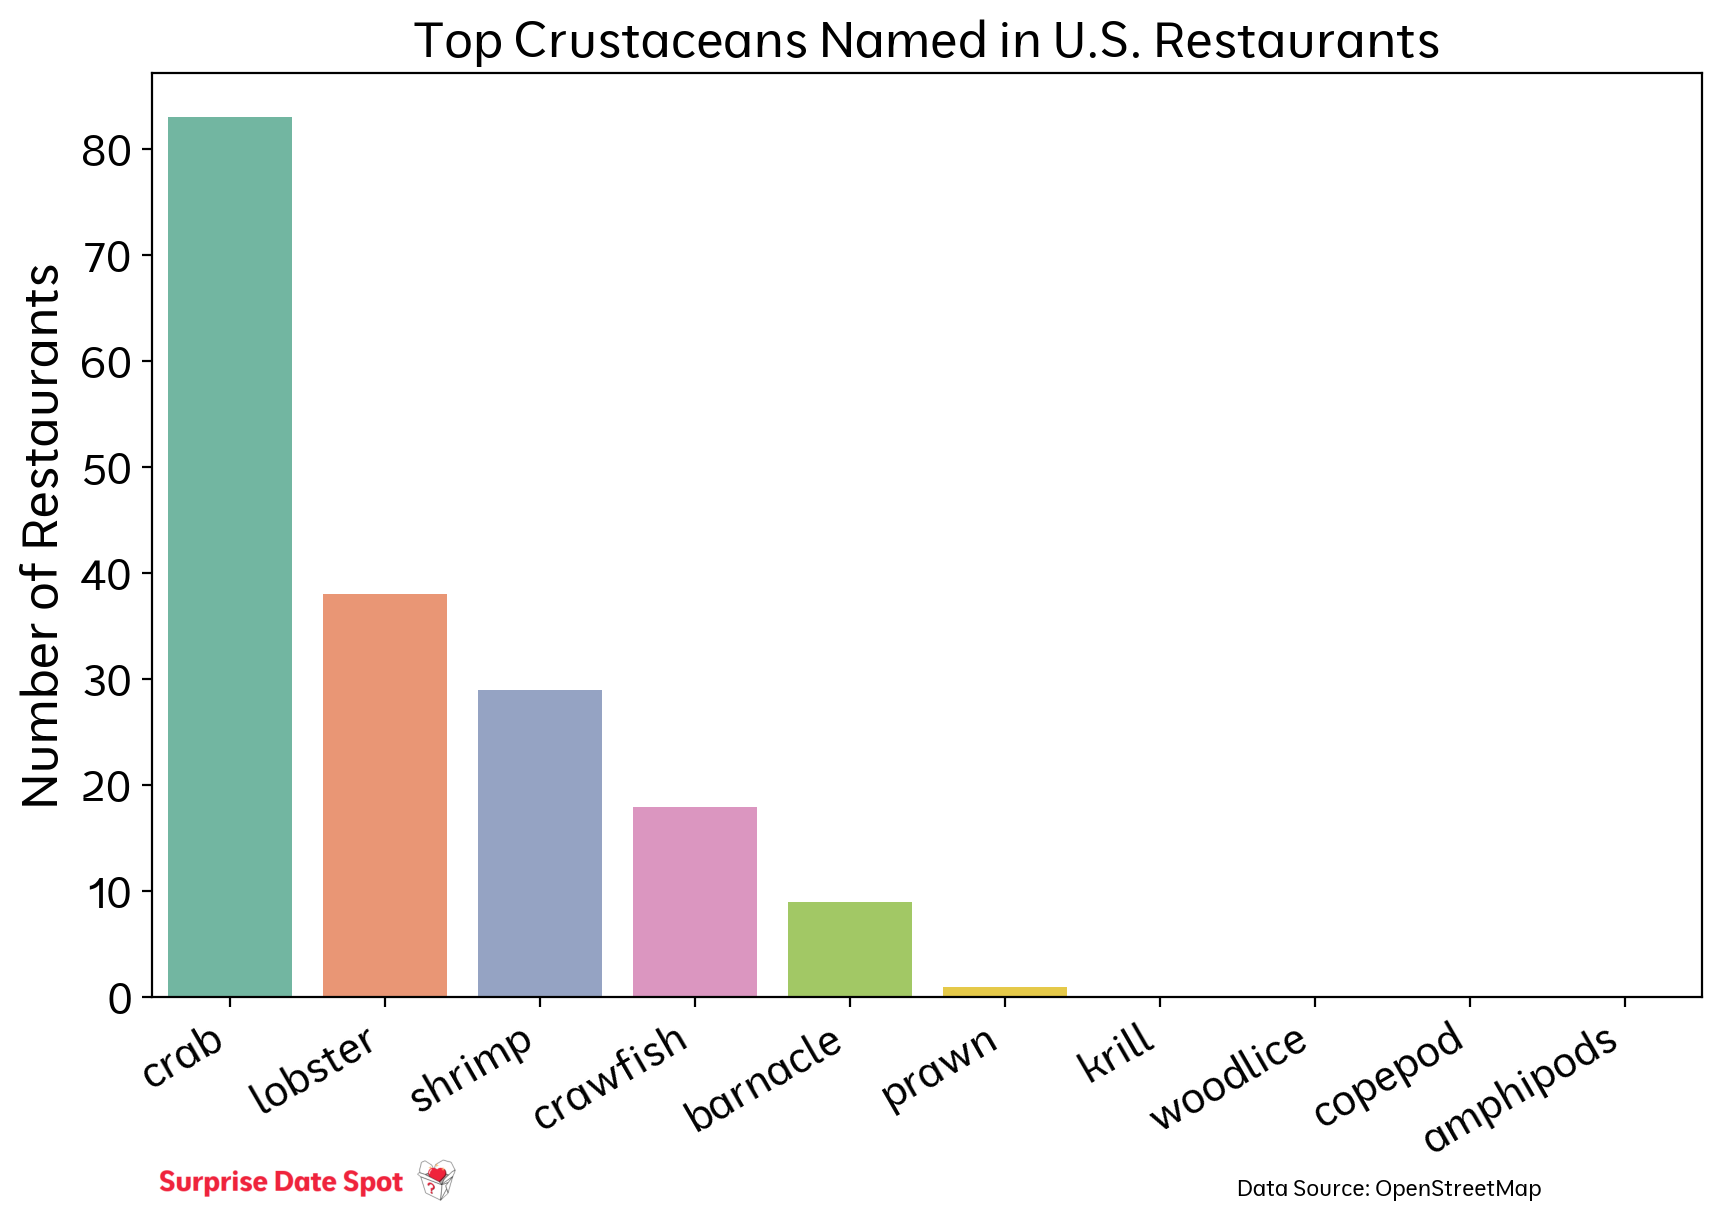
Someone on the OSM Slack asked me to create a variation of this graph showing only crustaceans, so here's that:
Colors
To find a list of colors, I tweaked Wikipedia's list of Crayola crayon colors.

The three primary colors are the most common, followed by neutral colors (black, silver, white). Interestingly, after primary colors, the metallic colors are the most common in names.
Feedback
Questions about the data shown here? Other trends you've noticed? I'd love to add more graphs to this page. Contact me at [email protected]
